National cups are something special for many teams and supporters. Today's match will decide whether it's Norwich City or Manchester United that keep their silverware dream alive.
It’s busy days for these teams as both were in action only a few days ago. There’s no rest for the wicked, or in this case; no rest for Norwich and Manchester United.
Norwich City form and stats
Norwich was eliminated in the 3rd round last season in the FA Cup.Norwich City's results here at Carrow Road in the Premier League have been very modest with 4 victories, 3 draws and 9 defeats. On the other hand, in the FA Cup, Norwich City has performed like this (both home and away): 2 wins, 1 draw and 0 losses. With three straight defeats the pressure is piling up on Norwich City to get some points in this home game. Norwich are very eager to stop a potential losing streak at Carrow Road, having lost their two previous games here.
Norwich are anxiously hoping for a goal as it's been 290 minutes since the last one in league fixtures. (Scored by J. Lewis).
The Norwich crowd went home unhappy last time out, seeing their beloved players lose 0-1 to Everton here at Carrow Road in a Premier League match. Preceding that match was a Premier League defeat to Southampton (0-3).
The manager D. Farke will start preparations for the next game as soon this is finished, as the hosts are going to Arsenal in only four days.
Norwich are certainly not overdoing their scoring at home in league matches, having created 19 goals in 16 games. With more than 1,5 conceded goals on average, the Norwich defense is not exactly impregnable. 30 goals conceded from 16 games. You can find more goal stats on the Statistics tab above.
Manchester United form and stats
They also participated in FA Cup last season. This ended in the quarter-finals.The visitors are W4-D5-L6 on the road this term. That's in the Premier League. The mentioned statistics is only from the league, looking at the FA Cup stats, they have 3 wins, 1 draw and 0 losses both home and away. Manchester has drawn their two previous away games.
Manchester are travelling after their nice 3-0 home win in the Premier League against Sheffield United. Before that, Manchester travelled to Tottenham Hotspur and returned home with a draw after the Premier League game finished 1-1.
It's hard not to mention Anthony Martial's lethal finishing against Sheffield United. three goals were a big reason for the important victory.
Manchester has another fixture away, a Premier League game, against Brighton & Hove Albion in just three days. A tough schedule for the visitors!
The visiting Manchester have scored more than one goal per away game in the league so far. The grand total is 16 goals from 15 games. As opposed to that, Manchester have seen the ball go into their own net 19 times on the road.
Head 2 Head
Norwich-Manchester United H2H statistics last ten meetings regardless of arena: Norwich City two wins, Manchester United eight wins, zero draws. seven of these ten matches had three or more goals (over 2,5).Top Goalscorers
 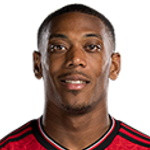 A. Martial 14 goals | 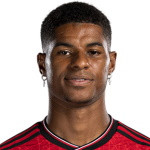 M. Rashford 14 goals |   T. Pukki 11 goals |
Norwich City missing players
Manchester United missing players
| Norwich City | Manchester United | ||||||
| Total | Home | Statistics | Stat | Away | Total | ||
| 25 | 12 | Played | P | 13 | 25 | ||
| 5 | 2 | Won | W | 6 | 14 | ||
| 6 | 3 | Drew | D | 4 | 6 | ||
| 14 | 7 | Lost | L | 3 | 5 | ||
| 22 | 10 | Scored | S | 22 | 49 | ||
| 39 | 19 | Conceded | C | 9 | 16 | ||
| 96% | 100% | Over 0.5 | O 0.5 | 92% | 92% | ||
| 72% | 67% | Over 1.5 | O 1.5 | 85% | 84% | ||
| 48% | 50% | Over 2.5 | O 2.5 | 23% | 40% | ||
| 20% | 25% | Over 3.5 | O 3.5 | 15% | 24% | ||
| 4% | 0% | Over 4.5 | O 4.5 | 15% | 16% | ||
| 48% | 50% | BTTS | BTTS | 23% | 24% | ||
| 16% | 17% | Clean Sheets | C S | 54% | 60% | ||
| 40% | 33% | Failed to Score | F T | 31% | 24% | ||
| 5.4 | 5.2 | Corners for (avg) | C F | 4.9 | 5.1 | ||
| 6.9 | 6.7 | Corners against (avg) | C A | 6.3 | 5.2 | ||
| 1.8 | 1.7 | Yellow cards (avg) | Y C | 1.9 | 1.6 | ||
| 1 | 1 | Red cards | R C | 1 | 1 | ||
| 279 | 138 | Total Shots | T S | 186 | 403 | ||
| 85 | 44 | Shots on Target | S O | 64 | 142 | ||
| 26% | 23% | Goal Efficiency | G E | 34% | 35% | ||
| Total | Home | Away | |||||||||||||||||||
| # | Team | MP | W | D | L | F | A | MP | W | D | L | F | A | MP | W | D | L | F | A | +/- | P |
| 1 | Liverpool | 31 | 28 | 2 | 1 | 70 | 21 | 16 | 16 | 0 | 0 | 44 | 12 | 15 | 12 | 2 | 1 | 26 | 9 | 49 | 86 |
| 2 | Manchester City | 30 | 20 | 3 | 7 | 76 | 31 | 15 | 11 | 2 | 2 | 41 | 12 | 15 | 9 | 1 | 5 | 35 | 19 | 45 | 63 |
| 3 | Leicester City | 31 | 16 | 7 | 8 | 59 | 29 | 16 | 9 | 4 | 3 | 30 | 15 | 15 | 7 | 3 | 5 | 29 | 14 | 30 | 55 |
| 4 | Chelsea | 30 | 15 | 6 | 9 | 53 | 40 | 15 | 7 | 3 | 5 | 22 | 15 | 15 | 8 | 3 | 4 | 31 | 25 | 13 | 51 |
| 5 | Manchester United | 31 | 13 | 10 | 8 | 48 | 31 | 16 | 9 | 5 | 2 | 32 | 12 | 15 | 4 | 5 | 6 | 16 | 19 | 17 | 49 |
| 6 | Wolverhampton Wanderers | 31 | 12 | 13 | 6 | 44 | 34 | 16 | 6 | 7 | 3 | 22 | 17 | 15 | 6 | 6 | 3 | 22 | 17 | 10 | 49 |
| 7 | Tottenham Hotspur | 31 | 12 | 9 | 10 | 50 | 41 | 16 | 9 | 3 | 4 | 30 | 16 | 15 | 3 | 6 | 6 | 20 | 25 | 9 | 45 |
| 8 | Sheffield United | 31 | 11 | 11 | 9 | 30 | 31 | 15 | 7 | 3 | 5 | 17 | 13 | 16 | 4 | 8 | 4 | 13 | 18 | -1 | 44 |
| 9 | Crystal Palace | 31 | 11 | 9 | 11 | 28 | 36 | 15 | 6 | 4 | 5 | 12 | 13 | 16 | 5 | 5 | 6 | 16 | 23 | -8 | 42 |
| 10 | Everton | 31 | 11 | 8 | 12 | 38 | 46 | 15 | 7 | 5 | 3 | 19 | 15 | 16 | 4 | 3 | 9 | 19 | 31 | -8 | 41 |
| 11 | Arsenal | 30 | 9 | 13 | 8 | 41 | 41 | 15 | 7 | 5 | 3 | 26 | 20 | 15 | 2 | 8 | 5 | 15 | 21 | 0 | 40 |
| 12 | Burnley | 30 | 11 | 6 | 13 | 34 | 45 | 15 | 7 | 2 | 6 | 20 | 19 | 15 | 4 | 4 | 7 | 14 | 26 | -11 | 39 |
| 13 | Newcastle United | 31 | 10 | 9 | 12 | 29 | 42 | 16 | 6 | 7 | 3 | 16 | 13 | 15 | 4 | 2 | 9 | 13 | 29 | -13 | 39 |
| 14 | Southampton | 30 | 11 | 4 | 15 | 38 | 52 | 15 | 4 | 2 | 9 | 16 | 31 | 15 | 7 | 2 | 6 | 22 | 21 | -14 | 37 |
| 15 | Brighton & Hove Albion | 31 | 7 | 12 | 12 | 34 | 41 | 15 | 5 | 6 | 4 | 19 | 16 | 16 | 2 | 6 | 8 | 15 | 25 | -7 | 33 |
| 16 | Watford | 30 | 6 | 10 | 14 | 28 | 45 | 15 | 4 | 6 | 5 | 17 | 18 | 15 | 2 | 4 | 9 | 11 | 27 | -17 | 28 |
| 17 | West Ham United | 31 | 7 | 6 | 18 | 35 | 54 | 15 | 4 | 3 | 8 | 23 | 28 | 16 | 3 | 3 | 10 | 12 | 26 | -19 | 27 |
| 18 | AFC Bournemouth | 31 | 7 | 6 | 18 | 29 | 50 | 15 | 4 | 5 | 6 | 17 | 23 | 16 | 3 | 1 | 12 | 12 | 27 | -21 | 27 |
| 19 | Aston Villa | 31 | 7 | 6 | 18 | 36 | 59 | 15 | 5 | 3 | 7 | 19 | 26 | 16 | 2 | 3 | 11 | 17 | 33 | -23 | 27 |
| 20 | Norwich City | 31 | 5 | 6 | 20 | 25 | 56 | 16 | 4 | 3 | 9 | 19 | 30 | 15 | 1 | 3 | 11 | 6 | 26 | -31 | 21 |
- Norwich City
- Norwich Evening News - (local newspaper)
- Manchester United
- Manchester Evening News - (local newspaper)
- Man U News - (news aggregator)